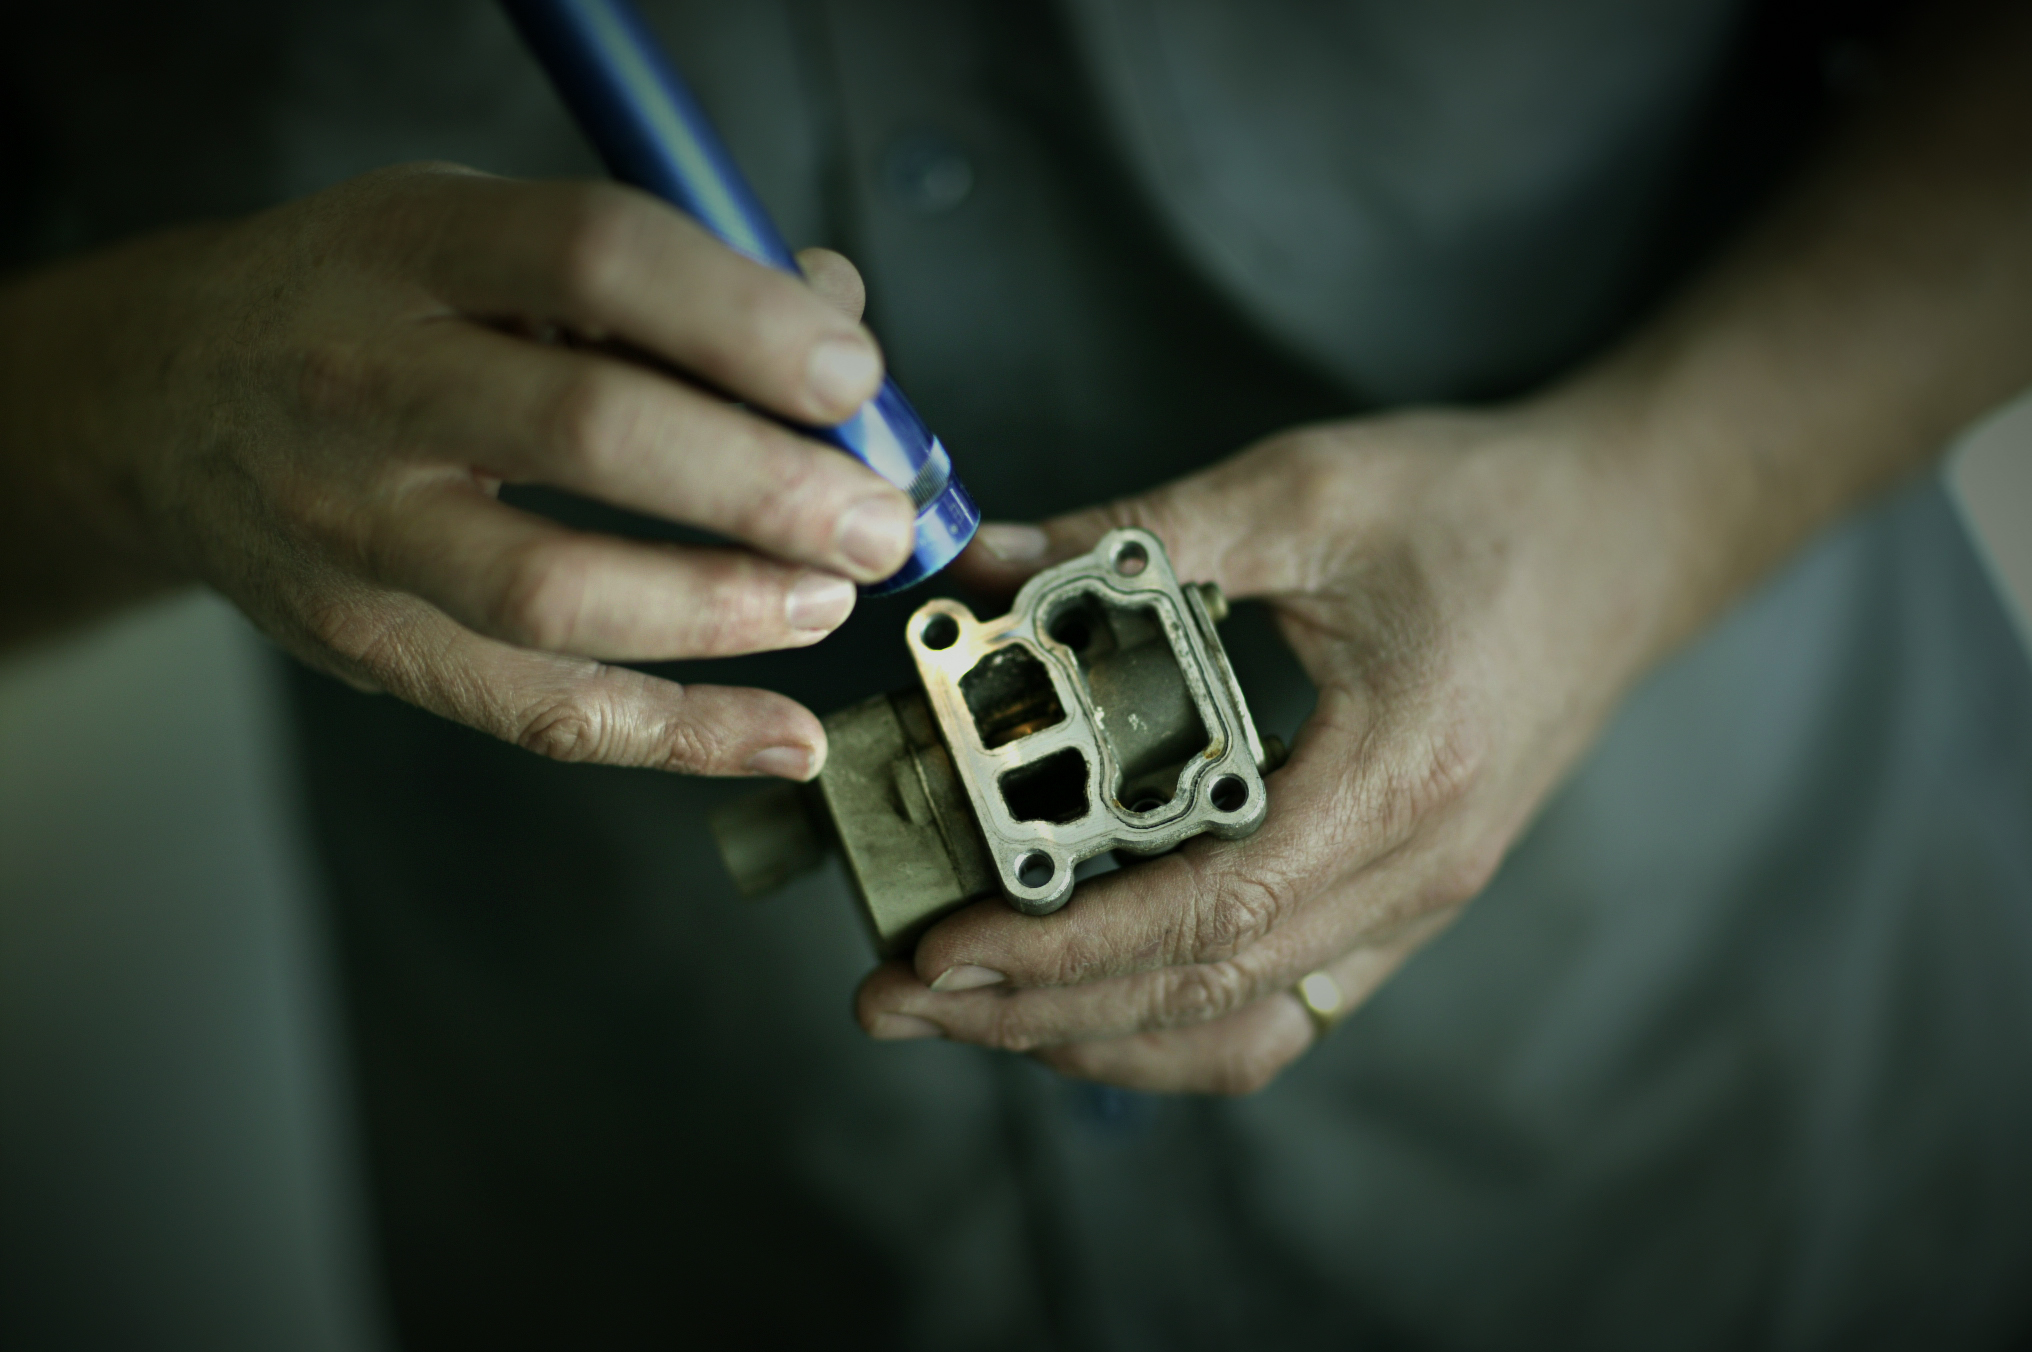
Case Study #342, 1997 Camry Stalling
“My engine won’t start.” A no-start is usually an easy diagnosis, but it’s really irritating when the engine starts immediately after the tow truck drops the front wheels to the ground. This 1997 Camry played that game. The rotary solenoid idle control device is the most common cause of a no-start on this generation of Toyota engines, but that’s just a guess now that the engine is starting fine.
The traditional no-start flow chart really doesn’t help here, because it assumes that the fault is present. But this fault is not present…or is it? Are there still indications of a fault with the idle control solenoid even though it’s working? Well, you’ll never see it in a flow chart, but this is the time to leverage your Scan Tool to quickly and non-invasively see if the idle solenoid is hanging up.
By ‘non-invasive’ we mean that you’re not grabbing tools and taking things apart. This is really important for 2 reasons:
- If you start ‘wrenching’ before you diagnose, you are changing the vehicle in some way. Did you break something loose, or help a poor connection make contact, thereby fixing the fault? You may think that the problem is simply not reproducible, when in reality you fixed it. Now it’s not billable time and you can’t make any assurances to the customer.
- This is the really important point – money! By leveraging your Scan Tool instead of taking things apart for inspection, you’re saving time, thereby increasing both your income and your customer’s satisfaction.
Test Procedure
The Scan Tool was connected, and the bi-directional controls for IAC (Idle Air Control) Duty Ratio were selected. The first example shows the command forced to 34%. You can run the command from 0% to 99% to check the range of the component. The data list had been trimmed to only 4 PIDs in order to speed up the data refresh rate.
The second example shows the RPM and IAC% PIDs graphed over time (during the bi-directional test) so you can see the relationship. If your Scan Tool graphs, use this function to get a better feel for component control and results. As you can see, the technician increased the IAC% command from 9% to 99%, and then back to 26%. The RPM, however, didn’t jump up until the IAC% command was over 70%. Using this simple graphing strategy, it’s easy to see that this idle control solenoid is sticking and needs to be replaced. With coolant hoses and gaskets this job exceeds $450, so it’s nice to be able to sell it with confidence that it’s not a ‘guess’.
This wasn’t a difficult diagnosis, but that’s not the reason we shared it with you. This is a good example of using tools and techniques in ways not addressed in traditional diagnostic information. This was a 5-minute confirmation of a fault that wasn’t actually presenting any symptoms at the time of diagnosis. Remember, the engine started fine after being towed in, but there were still some clues to be found when the solenoid was forced to its limits. Like other ATG case studies, this isn’t about some really clever solution to a once-in-a-lifetime scenario. Rather, it’s a demonstration of how an everyday diagnosis can be so much faster and more accurate. It sure beats the usual trade-off of guessing at a root cause vs. sending the customer out with ‘could not duplicate’ on their repair order.


